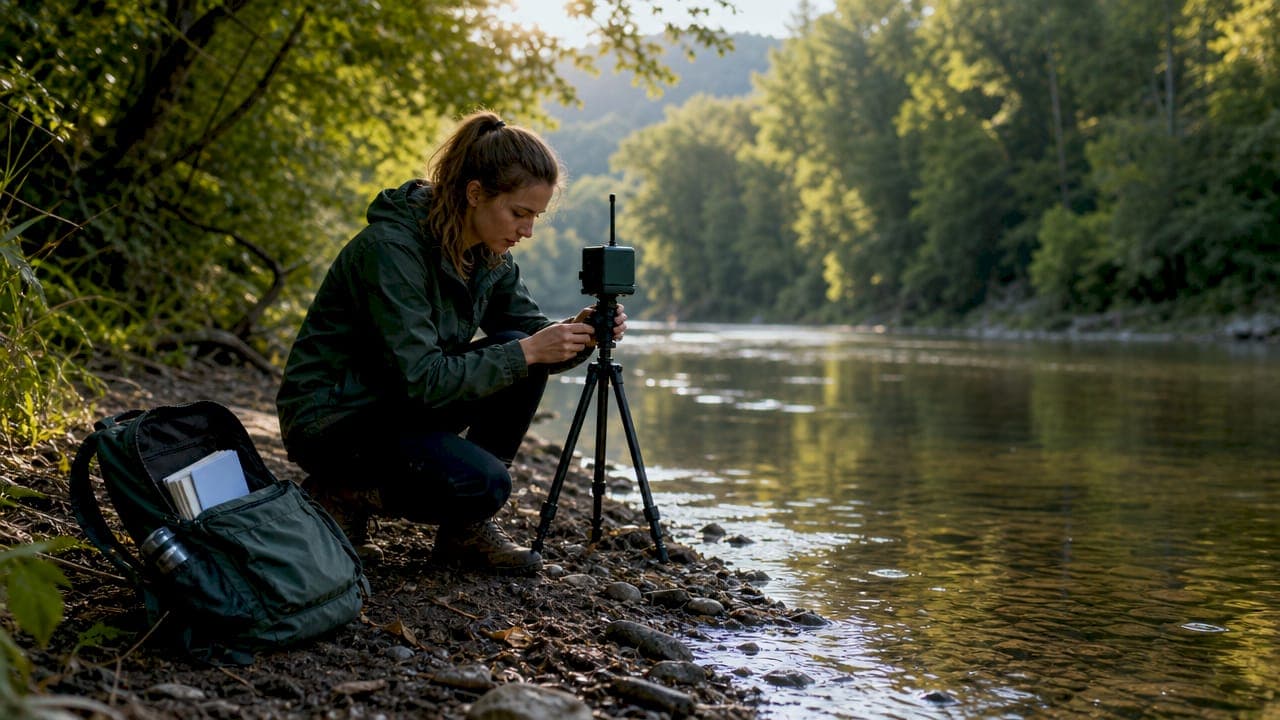
Environmental monitoring is defined as the systematic collection, analysis, and reporting of data on environmental conditions to track changes, detect risks, and guide management decisions. The U.S. Environmental Protection Agency, the United Nations Economic Commission for Europe, and ISO 14001:2026 all recognize environmental monitoring as a foundational requirement for both regulatory compliance and proactive environmental management. The core goal is not just to record what is happening in air, water, or soil, but to generate data that drives real decisions. For growers, researchers, and facility managers in Michigan, where Great Lakes water quality and agricultural runoff are active concerns, this process carries direct operational weight.
What is environmental monitoring and why does it matter?
Environmental monitoring is the structured practice of measuring specific environmental indicators over time to understand conditions and trends. Monitoring differs from assessment: monitoring is the systematic data collection, while assessment is the analysis that leads to actionable conclusions. That distinction matters because many organizations collect data but never build the analysis layer that makes it useful.
The primary goals of environmental monitoring are to track baseline conditions, detect deviations from acceptable ranges, and provide evidence for regulatory reporting. ISO 14001:2026 Clause 9.1 requires organizations to document what is monitored, how measurement occurs, the evaluation criteria used, and to retain evidence of results. That requirement applies to any organization operating an environmental management system, from a Michigan greenhouse to a large industrial facility.
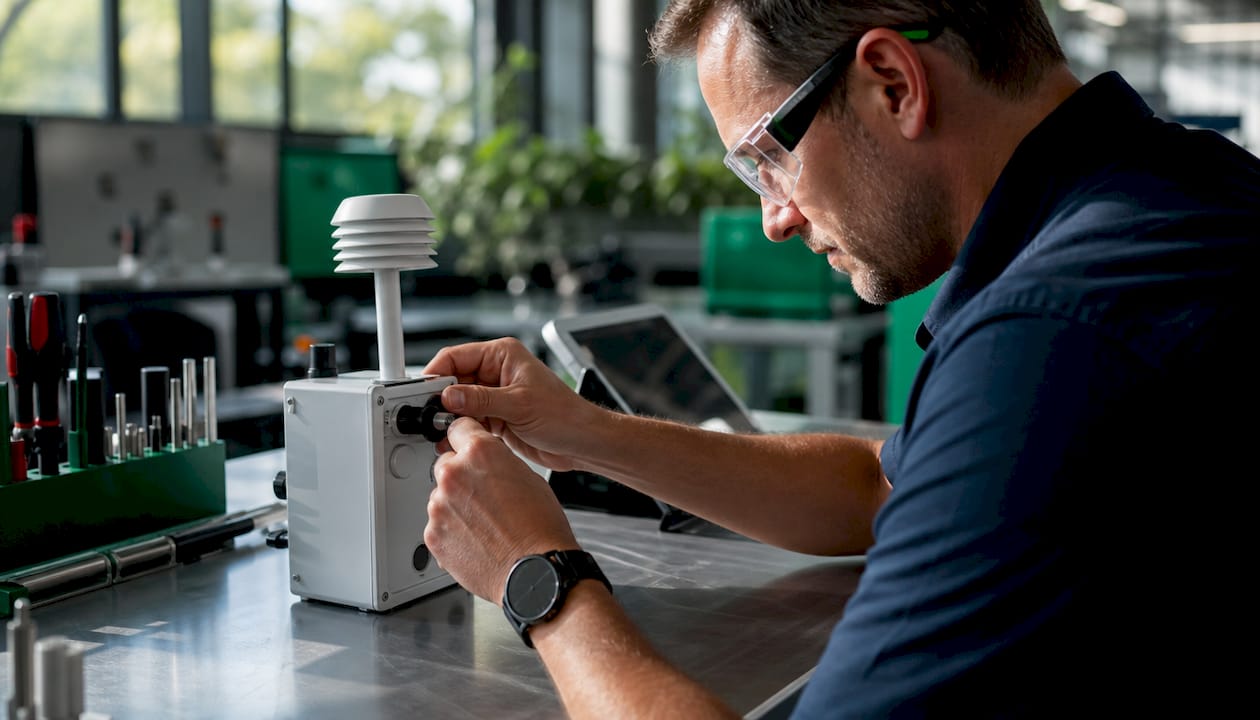
Environmental indicators are the specific, measurable variables that monitoring programs track. Common indicators include dissolved oxygen in water, particulate matter in air, nitrate concentrations in soil, and species counts in biodiversity surveys. Each indicator tells a specific story about environmental health.
What are the main stages of the environmental monitoring process?
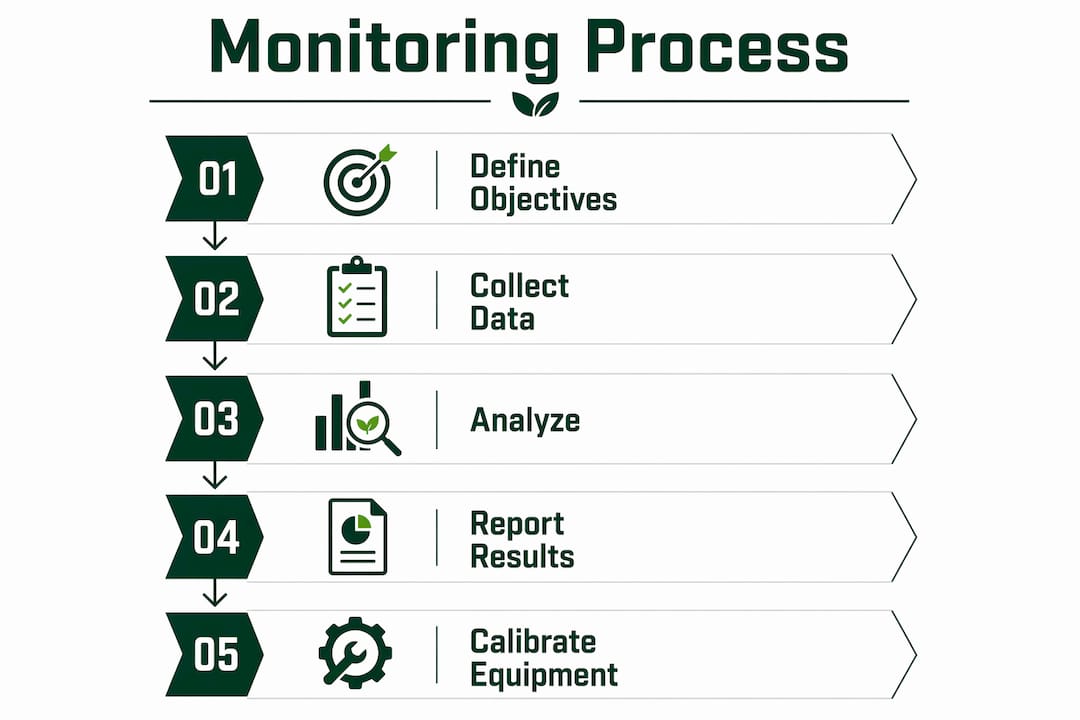
Environmental monitoring involves four core stages: defining objectives, collecting data, analyzing data, and reporting results. Each stage builds on the previous one, and skipping any stage produces unreliable outputs.
-
Define objectives and scope. Identify what you need to know and why. A Michigan vegetable grower monitoring irrigation water needs different parameters than a researcher studying Lake Erie tributaries. Clear objectives determine which indicators to track, at what frequency, and to what standard.
-
Collect data. Methods include direct grab sampling, continuous sensor networks, and remote sensing via satellite or drone. The method you choose determines the resolution and reliability of your data. Monthly grab samples, for example, miss rapid hydrochemical changes that only high-frequency sensors can capture.
-
Analyze data. Raw readings become useful only when analyzed for trends, anomalies, and threshold exceedances. This stage requires validated analytical methods and, increasingly, automated software that flags issues in real time.
-
Report and communicate results. Reporting closes the loop. Results go to regulators, facility managers, or the public, depending on the program. ISO 14001:2026 requires documented evidence at this stage, not just verbal summaries.
Pro Tip: Set your monitoring frequency before you buy sensors. The frequency drives the data volume, storage requirements, and analysis workload. Getting this wrong early creates expensive problems later.
What technologies and techniques are used in environmental monitoring?
The gap between traditional and modern monitoring techniques is significant, and the choice of technology directly affects data quality.
- Direct grab sampling collects physical samples at a single point in time. Labs then analyze these samples for specific parameters. This method is well-established and legally defensible, but it captures only a snapshot.
- Continuous sensor networks deploy fixed or mobile sensors that record readings at set intervals, often every 15 minutes or less. A study using 10 low-cost in situ stations with research-grade sensors found that high-frequency monitoring revealed contaminant loads 6–87% higher than traditional monthly methods. That gap is not a rounding error. It represents pollution events that monthly sampling simply never sees.
- Remote sensing uses satellite imagery, aerial drones, or airborne sensors to monitor large areas. This technique works well for vegetation health, land cover change, and surface water extent.
- Low-cost DIY sensor systems have expanded access to monitoring for smaller operations. Open-source hardware platforms now allow researchers and growers to build custom sensor arrays at a fraction of traditional costs.
- Integrated data management platforms pull data from multiple sensor types into one system. Fragmented data across spreadsheets and disconnected databases reduces decision-making efficiency. A single integrated platform eliminates that problem.
ISO 14001:2026 requires calibration and validation of all monitoring equipment. Uncalibrated sensors produce data that looks credible but cannot be used for compliance or confident operational decisions.
Pro Tip: Pair every low-cost sensor with a periodic reference sample from a certified lab. This gives you a calibration check and keeps your data legally defensible.
What types of environmental monitoring exist and what do they measure?
Environmental monitoring covers several distinct categories, each targeting different parts of the environment.
- Air quality monitoring tracks particulate matter (PM2.5, PM10), nitrogen dioxide, ozone, carbon monoxide, and volatile organic compounds. Regulatory agencies use this data to enforce clean air standards and issue public health advisories.
- Water quality monitoring measures dissolved oxygen, pH, turbidity, nitrates, phosphorus, and microbial contamination. In Michigan, this type of monitoring is directly tied to Great Lakes protection programs and agricultural runoff management.
- Soil monitoring assesses contamination from heavy metals, pesticides, and excess nutrients, as well as soil health indicators like organic matter content and microbial activity.
- Biodiversity monitoring tracks species populations, habitat extent, and ecosystem function indicators. It answers whether a given ecosystem is stable, recovering, or declining.
| Type | Key parameters | Common technologies |
|---|---|---|
| Air quality | PM2.5, NO2, ozone, CO | Fixed stations, portable sensors, satellite |
| Water quality | DO, pH, nitrates, turbidity | In situ sensors, grab sampling, lab analysis |
| Soil | Heavy metals, nutrients, organic matter | Core sampling, field test kits, lab analysis |
| Biodiversity | Species counts, habitat area, biomass | Field surveys, camera traps, remote sensing |
Each monitoring type uses different technologies, but all share the same process: define, collect, analyze, and report.
Why is environmental monitoring important for individuals, organizations, and policymakers?
Environmental monitoring supports public health protection, ecosystem preservation, better policymaking, and operational efficiency. These are not abstract benefits. They translate into concrete outcomes for specific groups.
- Public health: Air and water quality data trigger advisories that protect communities from exposure to harmful contaminants. Real-time monitoring systems now function as early warning tools, not just compliance records.
- Regulatory compliance: Agencies require documented monitoring data as proof of compliance. ISO 14001:2026 and U.S. EPA regulations both mandate specific monitoring frequencies and documentation standards.
- Ecosystem protection: Long-term monitoring data reveals trends that short-term observation misses. Detecting a gradual decline in dissolved oxygen in a Michigan river, for example, allows intervention before fish kills occur.
- Operational efficiency: For growers and facility managers, monitoring data identifies waste, inefficiency, and risk before they become costly problems.
"High-frequency, near real-time monitoring transforms environmental monitoring from a passive compliance tool into an early warning system for public health and operational management. The data is only as valuable as the speed at which it reaches decision-makers."
Stakeholder engagement also drives demand for open data. A survey conducted under Project NORDBALT-ECOSAFE found that 50–70% of stakeholders expect access to real-time online sensor data when it is publicly available. That expectation is reshaping how monitoring programs communicate results.
What are best practices and challenges in effective environmental monitoring?
Reliable monitoring programs share several characteristics that distinguish them from programs that collect data but never use it well.
Data validity is the foundation. ISO 14001:2026 mandates calibration, verification, and documented evidence for all monitoring activities. Without calibrated equipment and documented methods, data cannot support compliance claims or confident decisions. This is the most common failure point in monitoring programs of all sizes.
Integrated data management is the second critical factor. Structured data management involves collection, organization, validation, analysis, and reporting as a connected workflow. Programs that store data in disconnected spreadsheets or siloed databases cannot perform trend analysis or generate reliable reports without significant manual effort.
Real-time monitoring is shifting the standard for what "good" monitoring looks like. Programs that relied on monthly sampling are now under pressure to adopt higher-frequency approaches, particularly for water quality. The evidence that monthly sampling misses critical pollution events is now well-documented in peer-reviewed research.
Compliance with ISO 14001:2026 and U.S. EPA guidelines sets the minimum bar. The best programs go further by using monitoring data to drive operational improvements, not just to satisfy auditors.
Pro Tip: Build your quality assurance and quality control (QA/QC) protocol before you start collecting data. Retrofitting QA/QC onto an existing dataset is expensive and often inconclusive.
Key Takeaways
Effective environmental monitoring requires defined objectives, calibrated sensors, integrated data management, and a reporting structure that connects data to decisions.
| Point | Details |
|---|---|
| Definition is foundational | Environmental monitoring is systematic data collection on environmental conditions to track change and guide decisions. |
| Four-stage process | Define objectives, collect data, analyze results, and report findings. Skipping any stage reduces reliability. |
| High-frequency monitoring matters | Sensor-based systems reveal contaminant loads 6–87% higher than monthly grab sampling. |
| Integration prevents data silos | Fragmented data across spreadsheets reduces decision-making efficiency. One platform solves this. |
| ISO 14001:2026 sets the standard | Organizations must document what is monitored, how, and at what frequency, and retain evidence of results. |
Why I think most monitoring programs fail before they start
Philip here. After working with growers and facility operators across Michigan and beyond, I have seen the same failure repeat itself: organizations invest in sensors but not in the system around the sensors. They buy hardware, deploy it, and then discover they have no clear protocol for validation, no central place for the data, and no one assigned to act on the results.
The technology is rarely the problem. A well-placed, calibrated sensor network will tell you exactly what is happening in your environment. The problem is that most programs treat monitoring as a checkbox rather than a decision-support system. ISO 14001:2026 exists precisely because that gap is so common. The standard does not just require data. It requires documented methods, evaluation criteria, and retained evidence.
The shift I find most encouraging is the move toward real-time, high-frequency monitoring. When a grower in Michigan can see a nutrient spike in irrigation water within 15 minutes of it occurring, that is no longer compliance monitoring. That is operational intelligence. The research showing that monthly sampling misses 6–87% of contaminant loads should make every program manager uncomfortable with the status quo.
My honest recommendation: start with a clear objective, not a sensor catalog. Know what decision you are trying to make, then work backward to the data you need. That sequence produces programs that actually get used.
— Philip
Environmental monitoring solutions for growers and facility managers
Agriculturalautomationservices builds monitoring and automation systems specifically for controlled-environment agriculture, including greenhouses, indoor farms, and vertical growing operations in Michigan and across the U.S.
If you are running a grow operation and want to move from manual checks to continuous, reliable environmental data, Agriculturalautomationservices offers a Tier 1 Assessment ($500–$1,500) that identifies exactly where your monitoring gaps are. For operations ready to act, the Tier 2 Design and Implementation service delivers a custom sensor and automation system built for your facility's size and complexity. Visit Agriculturalautomationservices to see how integrated real-time monitoring connects directly to climate control, irrigation, and cultivation management in one platform.
FAQ
What is the environmental monitoring definition?
Environmental monitoring is the systematic collection, analysis, and reporting of data on environmental conditions to track changes and support decision-making. It is recognized by the U.S. EPA, UNECE, and ISO 14001:2026 as a core requirement for environmental management.
What are common environmental monitoring examples?
Common examples include air quality sensor networks measuring PM2.5 and ozone, in-stream water quality sensors tracking nitrates and dissolved oxygen, soil sampling programs for heavy metal contamination, and biodiversity surveys tracking species populations over time.
How does environmental monitoring work in practice?
Monitoring programs follow four stages: defining objectives, collecting data through sensors or sampling, analyzing data for trends and threshold exceedances, and reporting results to decision-makers or regulators.
What are environmental indicators?
Environmental indicators are specific, measurable variables used to assess environmental conditions, such as dissolved oxygen in water, particulate matter in air, organic matter in soil, or species counts in a habitat.
Why is high-frequency monitoring better than monthly sampling?
High-frequency sensor-based monitoring captures pollution events that monthly grab samples miss entirely. Research shows it can reveal contaminant loads 6–87% higher than traditional monthly methods, making it a more accurate basis for management decisions.